
Extras
Grafana dashboards
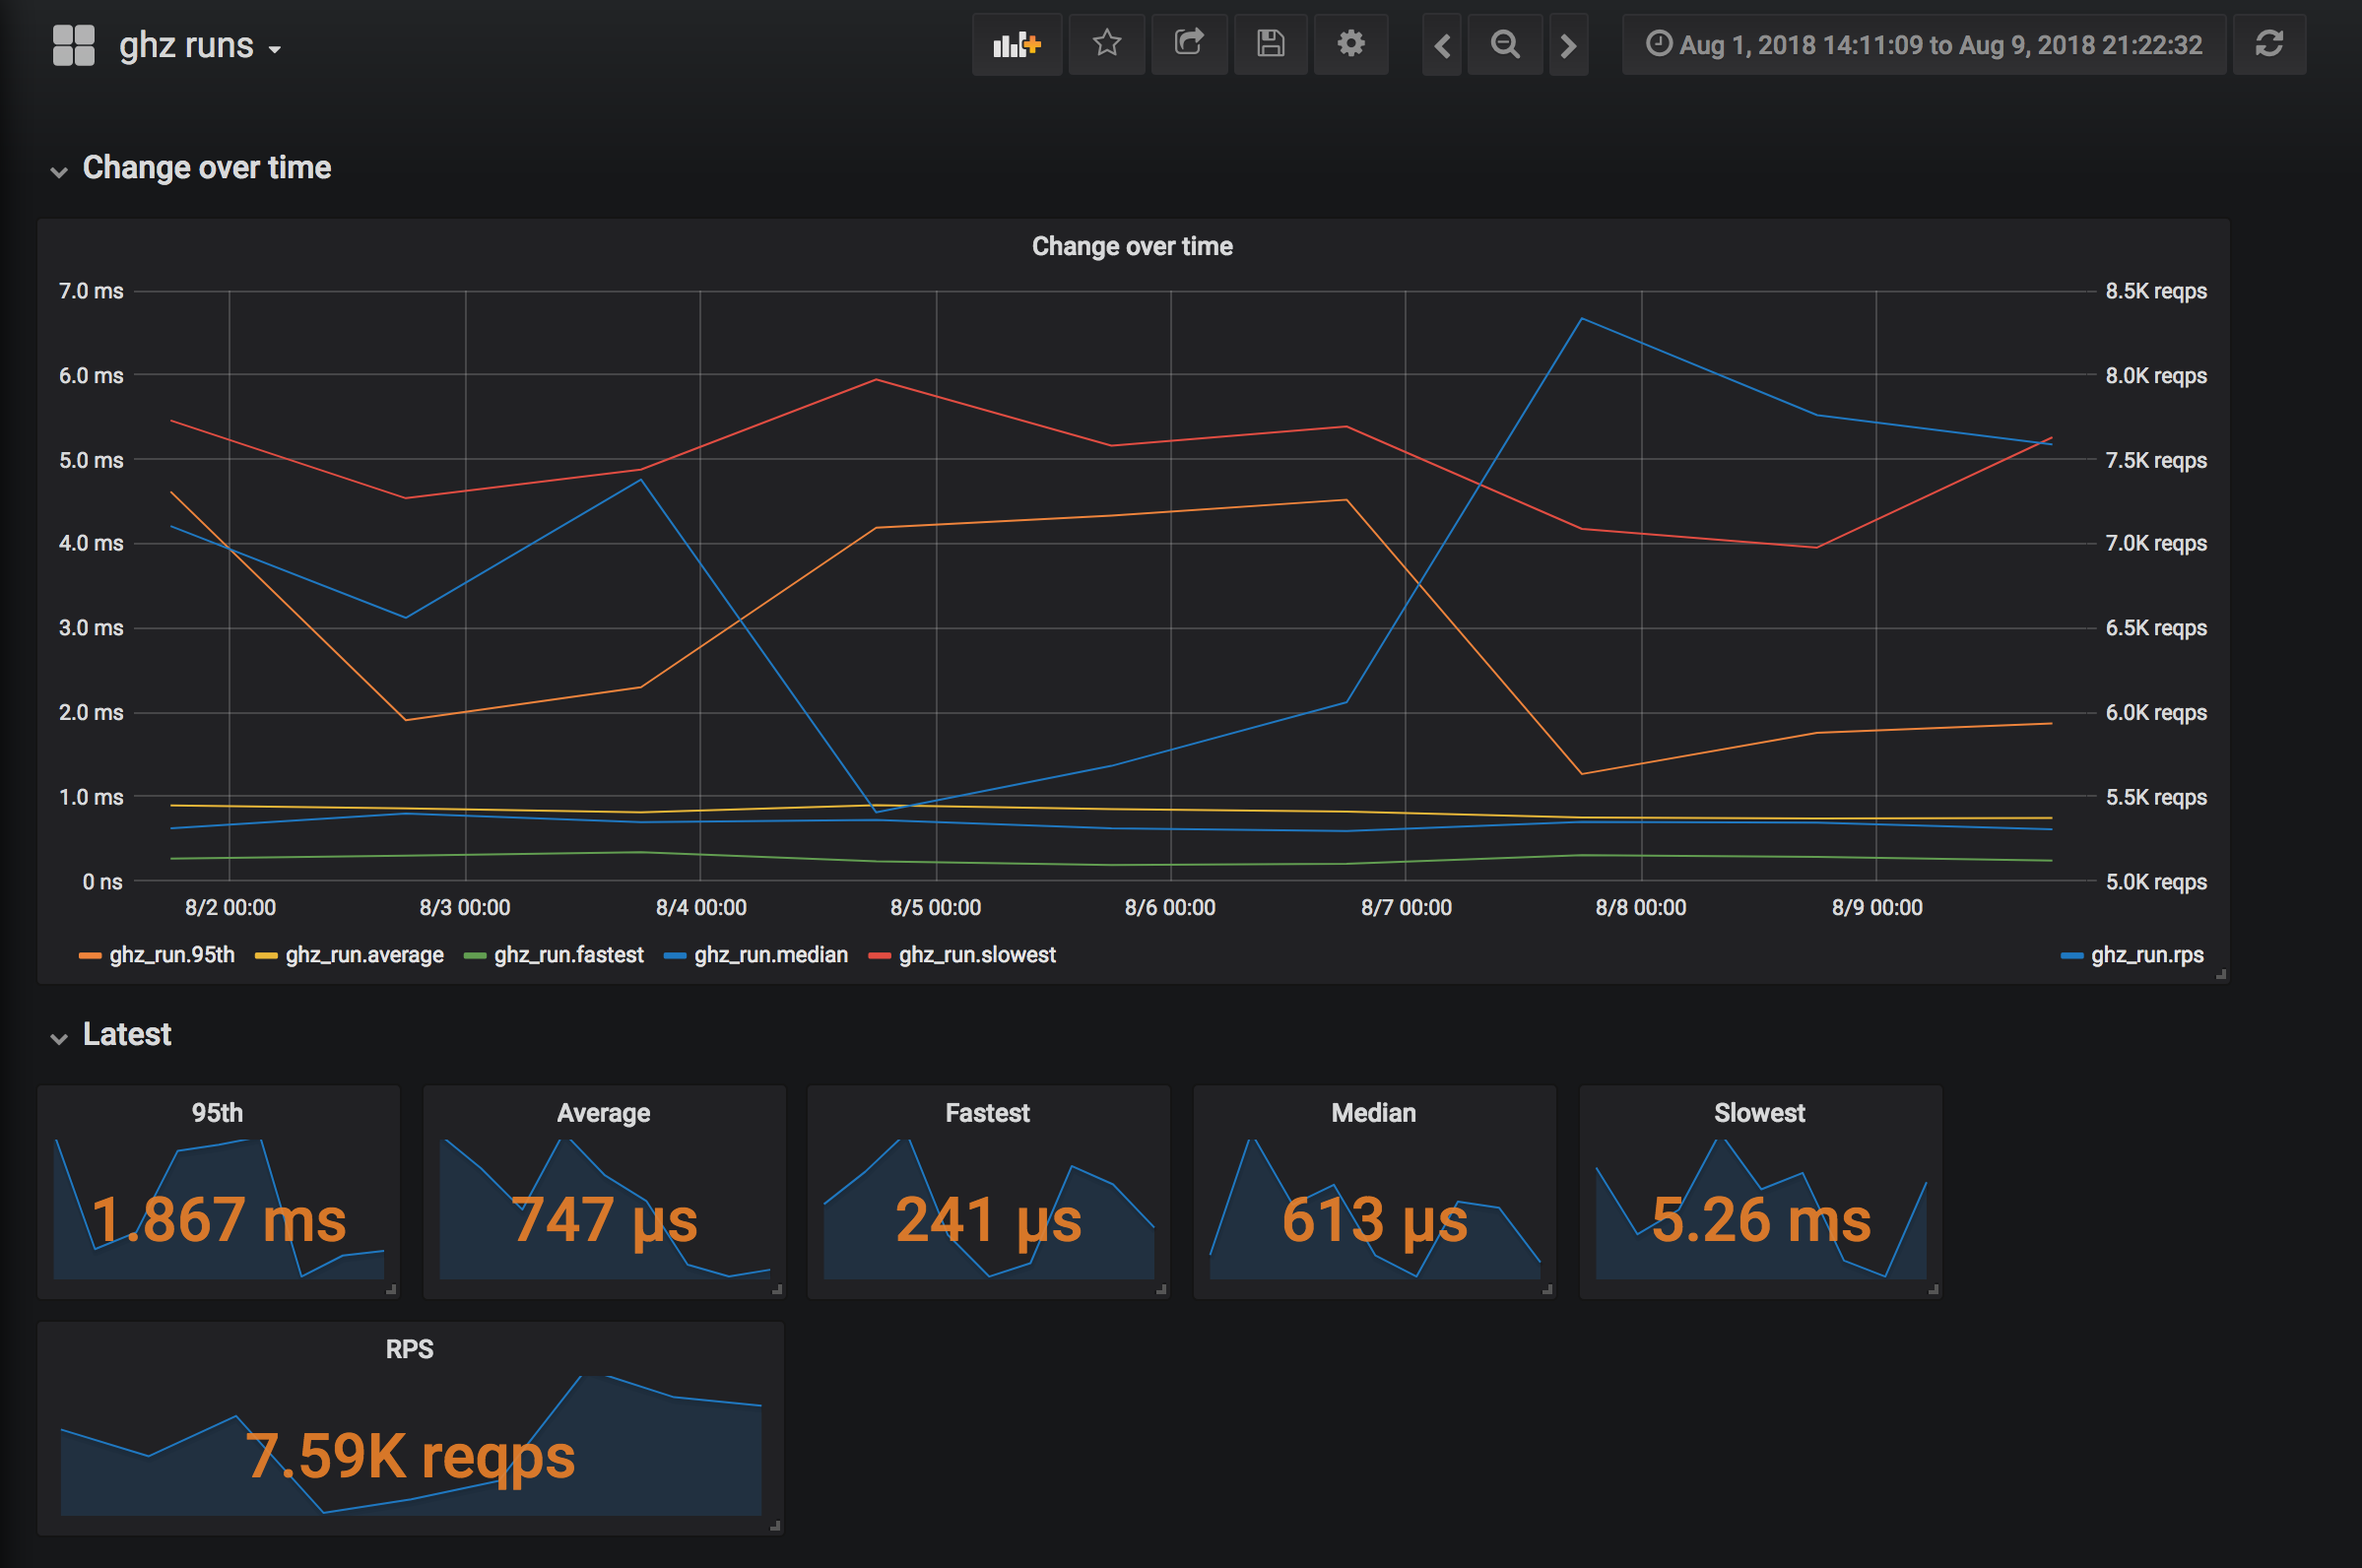
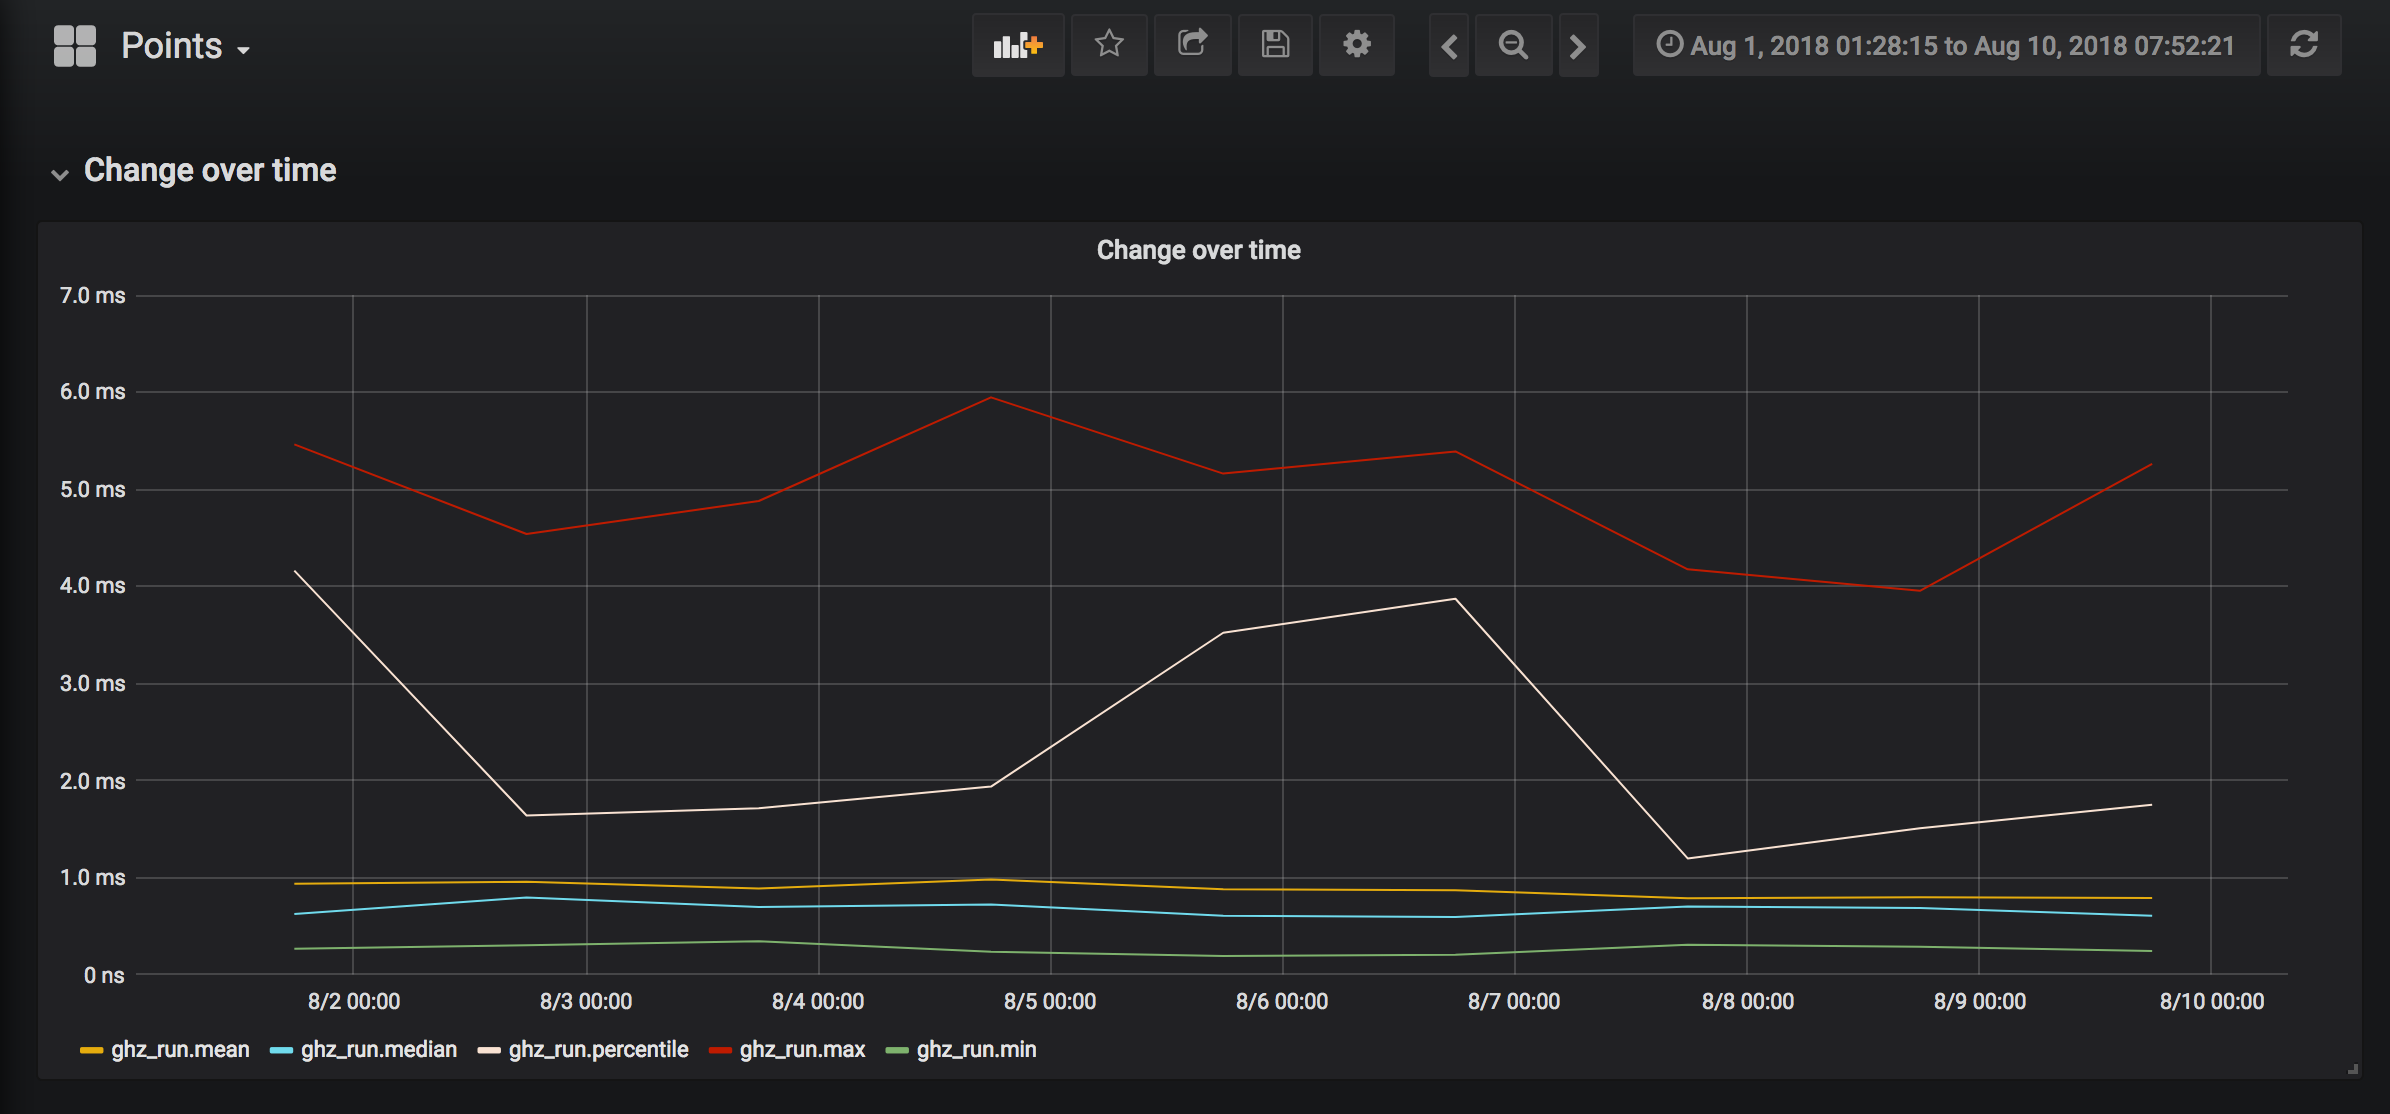
For convenience we include prebuilt Grafana dashboards for summary and details.
Summary Grafana Dashboard
Details Grafana Dashboard:
Prototool
ghz can be used with Prototool using the descriptor-set command:
ghz --protoset $(prototool descriptor-set --include-imports --tmp) ...